Featured Post

Doppler Analysis & Analysis of Leslie Cabinet

My previous post about the Doppler effect  provides a good explanation as to what the Doppler effect is and the properties of sound that ca...

Tuesday, September 29, 2015

Resonance

Resonance looks at the interactions between different objects. What happens when a vibrating object comes in contact with another object? Each object has natural frequencies of vibration or resonant frequencies. Using some data from my first lab as an example, we can see the natural frequencies of the harmonics of a single length of string with tension of 200 grams:
Frequency (hz)
Mode #
28.5
Fundamental (1st)
57
2nd
114
3rd
228
4th
456
5th
In order to get the string to reach stable harmonic structures, it had to be vibrated at these specific frequencies by the speaker that it was attached to. Resonance occurred at these five frequencies because the speaker was vibrating at the natural frequencies of the object. This gives us the definition of resonance: resonance occurs when a vibrating object comes into contact with another object and is vibrating at a resonant frequency of that object.

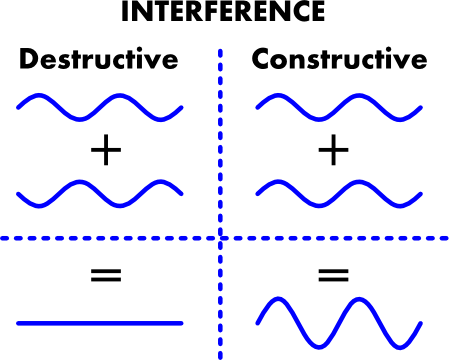
Resonance plays an integral role in the production of sound in instruments. Columns of air act as an object and have their own resonant frequencies, which I explored in my second experiment. This is fundamental in wind instruments. I like to use the clarinet as an example. To play a clarinet, one vibrates a reed on the mouthpiece, which creates resonance in the body of the instrument by vibrating the air particles in wave patterns that corresponding to the natural frequencies of the tube. In order to change the note being played, a clarinet player will place their fingers on different keys in order to block holes in the instrument. This changes the resonant frequency of the air column within the clarinet, which changes the frequency of sound produced by the instrument as the reed vibrates. The clarinet was designed so that the different fingering patterns create resonant frequencies that correspond to the frequencies of musical notes in the Pythagorean scale.

Works Cited:
1.  Gunther, Leon. The Physics of Music and Color. New York, New York: Springer, 2012.
2. "Resonance." Resonance. Physics Classroom. Web. 29 Sept. 2015.

Monday, September 28, 2015

Sound Wave Spatial Structure

The spatial structure of a sound wave is directly connected to my previous post about harmonics. In that post, I looked at the relationship between string length and wave velocity, but a comparison can be drawn between the wavelength of a sound wave and the length of its medium as well. This concept was critical in explaining the foundation of my previous two experiments, but was not something that I have dedicated a blog post to. This graphic does an excellent job of reiterating the harmonics of a sound wave, while also illustrating the relationship between the wavelengths of the harmonics and their relationship to the medium:

(The Physics of Music and Color)


Looking at the relationship between the wavelength and the length of the string (L) we get:
Harmonic Mode
Wavelength in terms of String Length(L)
1st
1/2L
2nd
L
3rd
2/3L
4th
2/4L
5th
2/5L
6th
2/6L
This relationship can be modeled by the same equation given in the previous blogpost:
This relationship relates well because the wave velocity (V) is a constant for a specific medium, and was arbitrarily chosen in the example above based on the graphic.

Works Cited:
1. Gunther, Leon. The Physics of Music and Color. New York, New York: Springer, 2012.

Friday, September 25, 2015

Harmonics

Harmonic frequencies are an essential part of sound. If you have read some of my previous posts and experiment summaries, you will probably have noticed references to different harmonic modes, but I have not dedicated a post to the concept yet. Harmonics are effectively different modes of vibration, sounds with different frequencies, that can exist in a medium (on a string or in a tube, for example). These different harmonics are often combined to create more complicated sounds in instruments through Fourier's Theorem. In this sense, harmonics are able to change the timbre of sound and to distinguish instruments. A good example of this is a comparison between the flute and the clarinet. The flute is effectively a column that is open at both ends, while a clarinet is effectively a column that is closed at one end. This means that the clarinet creates only odd harmonics, while the flute is able to create both odd and even harmonics. What does this mean?

Let's take a look at what the different harmonic modes look like on a string:
(The Physics of Music and Color)

The first harmonic is not pictured, but would have one antinode in the middle. As you can see, the harmonic mode number corresponds to the number of loops in the pattern. An even harmonic is a harmonic with an even number of loops, and an odd harmonic is the opposite. While this should provide a basic understanding of what harmonics are, we can look at them through a mathematical lens to understand the relationship between them.

In the image above, we see a full wavelength in the second harmonic. The first harmonic is half of a wavelength. We can break down the relationship between the length of the string and the harmonic mode number to look for a pattern:


Harmonic Mode
Wavelength in Terms of Wave Velocity (V) & String Length (L)
1
V/2L
2
2V/2L
3
3V/2L
4
4V/2L
5
5V/2L

While the 2L remains constant, the V coefficient increases by an interval equal to the harmonic mode number. From this observation, we can derive the equation:
(The Physics of Music and Color)

Works Cited:
1. Gunther, Leon. The Physics of Music and Color. New York, New York: Springer, 2012.

Thursday, September 24, 2015

Fourier's Theorem

In my initial post about the sine wave and all of its magical implications on sound, I mentioned that the sine wave is the building block of sound, meaning that every waveform can be produced by combinations of sine waves. I did not go into very much depth in this claim, however. The scientific explanation for this is given by Fourier's Theorem: "any periodic function that is reasonably continuous can be expressed as the sum of series of sine or cosine terms."
http://www.sfu.ca/sonic-studio/handbook/Fourier_Theorem.html

Initially this may be hard to grasp. How can every imaginable periodic function just be sine waves? I like to think of it by beginning with the concept of wave interference:

http://www.gwoptics.org/images/ebook/interference-explain.png

Imagine waves that aren't offset by those intervals, and you start to get more complicated waves. This is a good demo that illustrates this simply with three harmonic waves that you can combine:
http://phet.colorado.edu/sims/normal-modes/normal-modes_en.html

Once you reach a basic understanding of this concept, you can use this resource:
http://phet.colorado.edu/en/simulation/fourier
It provides you with the tools to make some very complicated waves, but it also gives you presets with different basic wave types to show how they are sums of sine functions.

An interesting extension of this is to look at the app's square wave:

What is interesting to me, is that the square wave is composed of only odd harmonics, which is identical to what happens to sound in a tube that is closed at one end. A clarinet is similar in that it is closed at one end. It is a bit more complicated though, because clarinets have a bell-shaped opening. Regardless, the waveform of sound from a clarinet looks similar to this square wave:


Tuesday, September 22, 2015

Standing Waves in a Column of Air Experiment

For this experiment, I looked at the sound produced by different PVC pipes when hit differently so that they would be open or closed tubes. I aimed to look at how the length of tube affected the pitch of the sound and how sound differs in an open vs. closed tube. I used five PVC pipes of different length with a constant diameter of 2 cm and a constant thickness. They were numbered as follows:
Tube #9
15.6cm
Tube #1
25.6cm
Tube #7
46.0cm
Tube #3
50.9cm
Tube #5
61.0cm

I recorded the fundamental frequency produced by hitting the top each pipe with my finger. For each length of pipe, I recorded the resulting frequency three different times. I plotted the average frequency for each length and calculated a best fit curve. I repeated this process by treating the pipe like a closed tube and hitting it with my palm. The data is plotted here:


What is interesting about this plot, is that the ratio between of the best fit curve of the open pipe to the best fit curve of the closed pipe is .52. In order to understand why this makes sense, you need to understand how a sound wave travels in a column. For a pipe that is open at both ends, the fundamental wave looks like this: 

For a pipe that is closed at one end and open at the other, the fundamental wave looks like this:

As you can see, 2L is the wavelength for an open tube's fundamental frequency, while 4L is the wavelength for a closed tube's fundamental frequency. The ratio between these two is .50. The value in practice was .52, however. Why is this larger value still accurate? In the real world, the nodes and anti-notes of a sound wave traveling through a pipe exist outside of the pipe's open ends. For the pipe open at one end, the effective tube length is the length of the tube + a third of the diameter. For the pipe that is open at both ends, two thirds of the diameter must be added to the tube length to find the effective tube length.

Using the same data set for the open pipe, one can create an estimate for the speed of sound. I plotted the wavelength and period for each pipe length. The slope of the line of best fit provides the approximate speed of sound:


The slope is 331.2 meters/sec which is the nearly the exact speed of sound at 0 degrees Celsius. The temperature in the room during the experiment was 24.6 degrees Celsius, however, which predicts an actual speed of sound of 345.76 degrees Celsius. This makes the percentage error 4.2%. This can be attributed the lack of precision in retrieving the information about the sound waves from the Logger Pro software and to potential fluctuation in the temperature of the room during the experiment, as this temperature was not monitored after data collection began.

Thursday, September 10, 2015

Generating a Sound Pulse in Air

Previous posts have focused on how sound travels along a string and how this relates to string instruments. In addition to traveling on strings, sound waves travel through air. This is not just critical for wind instruments, but for our entire perception of sound. To understand how sound travels through air, we must first understand what air is and why sound waves are able to pass through it.

Air is a collection of gas particles: mostly nitrogen with some oxygen and a small percentage of other gases, such as carbon dioxide. Like all materials in a gaseous state, particles in air are constantly moving, which creates pressure. As a sound wave passes through air, it creates localized changes in pressure. Condensations are areas of high pressure and rarefactions are areas of low pressure. These changes in pressure can be modeled well by a sine wave as sound passes through air. This process of creating condensations and rarefactions is how sound is able to travel from a vibrating string to your ear. It is also the driving force in the creation of sound in wind instruments where sound waves are not generated by vibrating strings, but by vibrating air particles in a chamber. The next post will feature the results of experiment that explores the way in which sound is able to be generated in a tube.


Works Cited:
1. Gunther, Leon. The Physics of Music and Color. New York, New York: Springer, 2012.

Tuesday, September 8, 2015

Standing Waves on a String Experiment

For the past two class blocks I have been working on an experiment involving sound and string. Understanding the interaction between sound waves and strings is essential in understanding string instruments, such as violin, guitar, or piano, but also illustrates concepts that are important in understanding the physics of music.

In this experiment, with the help of Jon Bretan, I attached a piece of string to a speaker and attached the string to a pole. Using an amplifier, I played sound of different frequencies through the speaker in order to find the natural frequencies of the string. This was visible in the string as it made wave shapes with clear nodes and antinodes. I measured the frequency needed to get the string to vibrate in its fundamental mode, as well as its harmonic modes. If this is hard to conceptualize, here is a video showing the changes in the string's modes as I changed the frequency of the sound playing through the speaker.
The frequencies corresponding to each harmonic were recorded as follows:
Frequency (hz)
Mode #
17.3
Fundamental (1st)
34.6
2nd
69.3
3rd
139
4th
277
5th
As you can see, each frequency is twice the previous frequency. This should be a familiar interval if you have read my post about the relationship between frequency and pitch, because doubling the frequency of a sound increases it by exactly one octave in pitch. The above video is a good example of why this is the case. 

The problem with these initial measurements is that the tension of the string was unknown, as it was simply tied down using a clamp. To remedy this, I collected more data, but used weights to tighten the string. The following data sets correspond to weights of 50, 100, and 200 grams respectively:

50 gram weight.
Frequency (hz)
Mode #
17.3
Fundamental (1st)
34.6
2nd
69.2
4th
138
8th
277
16th

100 gram weight.
Frequency (hz)
Mode #
19.5
Fundamental (1st)
39
2nd
78
4th
156
8th
312
16th

200 gram weight.
Frequency (hz)
Mode #
28.5
Fundamental (1st)
57
2nd
114
4th
228
8th
456
16th

As you can see, when the tension of the string increases, the frequency of the harmonics increases. In the context of musical instruments this makes perfect sense; for example, tightening the string of a guitar increases its pitch.


In addition to manipulating the tension of the string, I changed its thickness. I did this by tying an identical string to it in order to double its mass density. I also tied down this modified string using weights of 50, 100, and 200 grams. The following data corresponds to those trials:


50 gram weight.
Frequency (hz)
Mode #
15.1
Fundamental (1st)
30.2
2nd
60.5
4th
121
8th
242
16th

100 gram weight.
Frequency (hz)
Mode #
16
Fundamental (1st)
32.1
2nd
64.1
4th
128
8th
256
16th

200 gram weight.
Frequency (hz)
Mode #
18.6
Fundamental (1st)
37.1
2nd
74.2
4th
148
8th
297
16th

As expected, increasing the tension of the modified string increased its fundamental frequencies, but what difference was caused by the change in the string's mass density? In looking at the fundamental frequencies we get the following comparisons for the strings with varying tension: 17.3 vs. 15.1; 19.5 vs. 16; and 28.5 vs. 18.6 with the initial string listed first and the modified string listed second. The data appear to show that the more dense string resonates at lower frequencies. Again, this makes sense; the guitar strings that are lower in pitch are thicker. 


Fortunately, there is a handy relationship between frequency and the tension and mass density of a medium.

This shows that frequency is proportional to the root of tension and inversely proportional to the root of the mass density. The data follows this trend, as increased mass density decreased the frequency and increased tension increased the frequency. If the data is hard to conceptualize, thinking about this relationship in the context of a guitar string can be very helpful. 

While the data appear to follow this trend generally, it does not follow the relationship. The fundamental frequencies of the first and second mode were graphed. The data for the original string and modified string are plotted on the same graph, but no trend can be inferred, as there are only two different mass densities. Clicking the images will open them in full size, so that you can read the text.

First Mode:

Second Mode:

As you can see, the lines of best fit are quadratic. This is unexpected because frequency is proportional to the square root of tension and not the square of tension.