Featured Post

Doppler Analysis & Analysis of Leslie Cabinet

My previous post about the Doppler effect  provides a good explanation as to what the Doppler effect is and the properties of sound that ca...

Thursday, March 24, 2016

Moog Sub Phatty Waveform Purity Analysis

Recently, I have brought my Moog Sub Phatty into school to study it from the perspective of my independent study. My primary method of analysis is measuring the voltage output from the Sub Phatty's headphone jack:


The voltage data output from the synthesizer reflects the sound wave it produces; this is how sound is transferred through electronics. I was initially curious as to how the Sub Phatty's different wave forms impact the sound waves it produces. The waveshapes available are controlled by this knob:


Moog describes them, starting from the bottom left and going clockwise, as triangle, sawtooth, square, and narrow pulse waves. I decided to arbitrarily number each of the lines around the wave knob, starting from one and going to eleven in the same clockwise order. In analyzing the sound produced by the different waveforms, I wanted to assess purity. In order to quantify "purity," I measured how well each wave is fit by a sine wave curve fit. I determined this by calculating the sine fit correlation. 

The following table shows the wave number and the value of its sine fit correlation (with the bold numbers representing the waveforms named in the Moog's manual):

Wave Number:Sine Fit Correlation:
10.9966
20.9937
30.9555
40.8839
50.8168
60.7608
70.8669
80.9122
90.8201
100.5641
110.3595

What was initially interesting is how pure the "triangle" wave is. While I was not surprised by the sine fit correlation of .9966 given how pure the tone sounded to me, it is interesting that it is named a triangle wave when it seems to essentially be a sine wave.
Another interesting observation is that there is not a real correlation or trend between the wave number and its sine fit correlation as I had hoped for. However, this table provides a sense of how "gritty" or impure each of the Sub Phatty's waveforms are, which can be useful in sound design. For a harsher tone, it is best to select one of the waves with a lower correlation. Hopefully this table can serve as a reference point.

Tuesday, March 1, 2016

Analysis of a Distortion Circuit

Building on my post about distortion, I built a distortion circuit with the help of Jon Bretan. The circuit takes in audio signal and uses transistors to distort the signal. Instead of outputting the distorted signal to a speaker, I recorded it using voltage probes. The final setup looked like this:

I recorded the voltage input (red) and the distorted signal (blue) in several different scenarios. First, I recorded the data for sawtooth, square, and triangle waves to look at how distortion uniquely effects each waveform. The data are pictured below:

100.87 Hertz Sawtooth:


100.87 Hertz Square:


100.87 Hertz Triangle:


Interestingly, the distorted waveform has a unique shape for the different input waves. The distortion is clear in the jagged and flattened parts of the blue wave, and it makes sense to see the amplitude of the distorted waveform match the general shape of the initial waveforms.  The type of distortion occurring here is called clipping, and I will be dedicating a brief blog post to this in the future. Normally, clipping results in a louder seeming wave because the top of the initial wave is "flattened" as it reaches peak intensity. However, in this circuit, the distorted sound is not amplified to a level that would make this apparent as its magnitude is significantly lower than the initial signal.

After looking at these different waveforms, I took a basic sine wave signal and recorded it at a range of frequencies to see how the frequency impacted the distortion occurring in the circuit. The following data represent the frequency range I was able to record:

59.44 Hertz Sine:


100.87 Hertz Sine:


200 Hertz Sine:


302.27 Hertz Sine:


403.48 Hertz Sine:


493.88 Hertz Sine:


I initially did not think that the effect of the distortion would not be significantly affected by the frequency of the input signal. However, looking at the data in order of increasing frequency reveals a really fascinating trend. The input signal for all the frequencies seem to be perfectly uniform, but the distorted signal at higher frequencies appears to follow a sinusoidal pattern. The peaks and troughs of the distorted signal that follow the shape of the clean signal seem to be superimposed over a sine wave. It is likely that this added oscillation is caused by the electronic components of the circuit as electric current flows through. It is interesting to see how this effect is only very clear for the higher frequency sine waves.

Works Cited:

Sunday, February 28, 2016

Death Valley & Singing Sand

I spent the past week in Death Valley for my Marin Academy Minicourse, and I discovered something that connects the environment of the desert to my study of sound. I've decided to do some additional research and add write blog post about this topic in order to better understand a fascinating natural phenomenon and to commemorate my wonderful Minicourse experience.

The Eureka Valley Sand Dunes in Death Valley are an impressive range of towering sand dunes. What makes them even more interesting, however, is that a low, mysterious rumble can be heard when traversing the dunes and in the nearby area. Can the sand dunes be the source of this sound? It can be heard here:


The name of this phenomenon is called "singing sand." When a strong wind disrupts a sand dune, the sand particles roll down the side of the dune and vibrate. These vibrations create reverberations throughout the dry top layer of the sand in a dune, which amplifies the sound, producing the Eureka Valley Sand Dunes' characteristic "booming."

While research has been done on this topic, such as the research done by the Caltech engineers in the video above, there is still some uncertainty surrounding singing sand. Much debate exists surrounding the factors that determine the pitch of the sound produced by sand dunes. Three hypotheses are that the size of the sand particles, the depth of the top layer of sand, or the speed of displaced sand control the pitch of the sound.

It is exciting that more research is needed, and I look forward to reading about or even participating in future developments in our understanding of singing sand.

Works Cited:

Phasing & Phase Cancellation

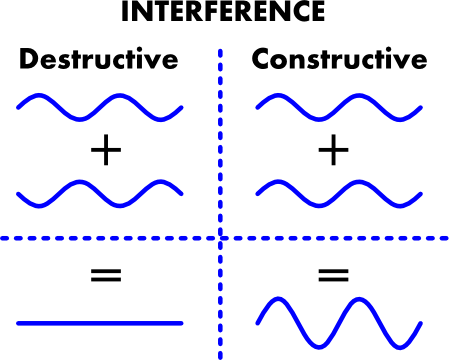
As governed by the laws of physics, sound waves have specific interactions when they come in contact with each other. A good model of this is Fourier's theorem, which shows that simple sine waves with different characteristics can combine to create a more complicated sound wave. This graphic from my post on Fourier's theorem is very important in relation to a phenomenon called phase cancellation:

The constructive waves are called in phase because their periods are the same and they line up perfectly with each other. The destructive waves, on the other hand, are called out of phase because they are shifted relative to each other. Because the waves are exactly half of a period out of phase, they cancel each other out and produce no sound. The interference caused by of out of phase sound waves creates what is known as phase cancellation. 

Phase cancellation is an integral part of music technology, especially as most audio is recorded and mixed in stereo. When you have two speakers playing the left and right channels of a song, a slight offset in the sound produced by the speakers can result in phase cancellation, which ruins the sound reproduction. When recording an instrument in stereo, phase is an important consideration in regards to microphone placement. If microphones are set up such that they record the same sound, but at an offset in phase, the recording can be ruined.

It is clear that complete phase cancellation is something to be avoided in recording and mixing audio. However, like with distortion, phasing is often used in moderation as a desirable effect. By shifting the phase of the left and right channels of a sound with a phase effect, both constructive and destructive interference occur to different parts of the sound wave. The manipulated sound wave ends up with a distinct quality due to the unique filtering of the phase effect. This video illustrates the difference between a clean guitar sound and a guitar sound affected by a phase effect.

Works Cited:

Wednesday, February 3, 2016

Echo & Reverb

Echo and reverberation, commonly referred to as reverb, are two naturally occurring sound effects that are also commonly utilized digitally in the context of music production. Echo and reverb are similar in nature as both are caused by the reflection of sound waves. However, sound reflection is perceived very differently by the human ear depending on certain factors. This is why echo and reverb are considered to be different effects.

Most people are familiar with echo. It occurs when a sound is reflected and then can be heard again after a short delay. An echo generally sounds very similar to the original sound but at a lower volume. This effect often occurs in nature places like canyons and other large open spaces with walls that can reflect sound.

Reverb may be a bit more unfamiliar to someone who does not produce or play music. This video provides examples of different kinds of reverb and how they affect the original sound.
The differences between the original sound and the sounds with reverb effects should be easy to perceive even on low quality speakers.

What distinguishes reverb from echo is the time it takes for a reflected sound to come back to your ear. Sounds that return after less than .1 seconds are perceived as reverb, while sounds that take longer to reflect are perceived as an echo. When the time interval is shorter than .1 second, the human brain perceives the original sound and the reflected sound as a single sound wave.

Because reverb is an effect that occurs naturally in most acoustic environments, it is critically important to include reverb in music production, especially electronic music production, because it sounds natural to the human ear. Electronic instruments and synthesizers lack natural reverb, so it is generally essential to add some sort of simulated reverb. This can be done through a plugin that digitally simulates reverb effects or naturally by playing a recording of the instrument in an acoustic environment and then recording it with a microphone. Adding appropriate reverb allows synthesizers to sound more natural and to fit better into a mix that involves acoustic instruments.

Works Cited:

Monday, February 1, 2016

Sound Distortion

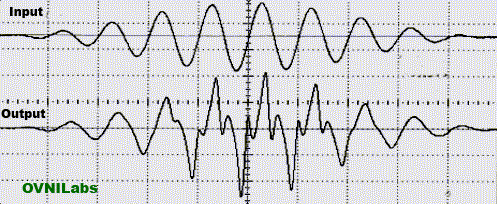
Distortion in the context of music is a word that is often tossed around by people who do not have a sufficiently clear or deep understanding of what it actually is. Fundamentally, distortion describes a change in a sound's waveform that occurs as the sound is being transmitted electronically or digitally. Viewing a wave form digitally can illustrate distortion quite well. The following image shows an audio signal and then the same signal after being distorted:

Given the focus on sound, we also want to be able to hear and recognize distortion. The guitar in the following video presents a clearly audible difference between a more pure sound and a distorted sound:

An interesting takeaway from this video is that distortion is not something that is intrinsically bad; many guitar and bass amps have a distortion knob as a feature. Moderate and proper usage of distortion can often be used to enhance the sound of an instrument in the right musical context, but what causes this change in a sound's waveform?

There are two main categories of distortion: linear and nonlinear (commonly harmonic distortion). In linear distortion, the amplitude of different parts of the sound wave are changed, and in nonlinear distortion, different frequencies or harmonics are added to the sound. This explains why distortion can be utilized in a beneficial way - adding appropriate harmonics can add complexity to a sound while adding clashing harmonics can make something sound inharmonious. To add a bit of information about how electronics pertain to distortion, "Harmonic distortion in amplifiers is usually caused by the amplifier needing more voltage than its power supply can provide. It can also be caused by some part of the internal circuit (usually the output transistors) exceeding its output capacity"(Source).

The two main branches of distortion, linear and nonlinear, can be broken down into many different types of distortion. Harmonic distortion is often the type of distortion that people refer to when speaking about distortion, and I have addressed it already, but other types include bandwidth distortion, intermodulation distortion, dynamic distortion, temporal distortion, noise distortion, and acoustic distortion. If you are interested in more information about these specifics types of distortion, this source provides descriptions with good depth about all of them.

Works Cited:

Sunday, January 31, 2016

Doppler Analysis & Analysis of Leslie Cabinet

My previous post about the Doppler effect provides a good explanation as to what the Doppler effect is and the properties of sound that cause it to exist. I decided to collect some data to try to provide a more tangible example of the Doppler effect at work in both a simple system and in a Leslie cabinet. 

To get a simple measurement of the Doppler effect, working with Jon Bretan, we attached a battery to a simple buzzer so that it was constantly producing sound and tied some string tightly around these two objects. With the buzzer tied to one end of the string, we were able to spin it in a circle. We recorded the changes in sound pressure over the span of one second, and we also recorded the stationary buzzer to act as a control. This is our initial data set:

Both the uniformity of the sound pressure data and the thin band of frequencies on the fast Fourier transform show the purity of the tone generated by the stationary buzzer. In contrast, the complicated shape of the sound pressure data for the rotating buzzer reveals a much more complicated sound wave. The breadth of frequencies shown on the fast Fourier transform best illustrates the Doppler effect. Because the buzzer was moving relatively to the microphone, the microphone picked up many more frequencies than the central pitch generated by the stationary buzzer. The mix of frequencies appear to be fairly uniform, but they are not perfectly uniform due to aspects of the rotation that were not controlled, such as ensuring that the buzzer rotated in the same plane as the microphone. Despite this, the data set gives a very clear example of the Doppler effect at work. Using the same methodology, I recorded the frequencies produced by a popular piece of music equipment.


The Leslie cabinet, as I mentioned in my previous post about the Doppler effect, is an amplifier with a very unique way of producing sound. The cabinet is divided into two sections, the horn and the drum, which produce high and low pitches respectively. The speaker in each section has two speeds of rotation, fast and slow, and can also be stationary. I played a sine tone at 440 hertz through the Leslie cabinet and used a microphone to collect data for both the horn and the drum at both speeds. Additionally, I recorded sound produced by the stationary setting as a control. 

The following data comes from the sound produced by the horn (higher pitch speaker):

The data appears similar to the simple Doppler generator as the faster rotating speaker produces a wider spread of frequencies. The logarithmic scaling of the Y axis reveals the incredible level of symmetry of the frequency spread. This reveals an important distinction between the simple spinning buzzer and the Leslie cabinet and suggests that the uniform rotation of the Leslie cabinet produces the uniform frequency spread that was recorded.

The following data comes from the sound produced by the drum (lower pitch speaker):
Looking at the full frequency range, we are able to see the very low pitch produced by the drum as well as the central tone of the 440 hertz sine wave. We are also able to see the frequency spread caused by the Doppler effect.

When we look at the same frequency range as the horn data, we are able to clearly see the Doppler effect:
The similarities in frequency spread that correspond to speed of rotation are a clear indicator of the Doppler effect in the Leslie cabinet. Again, we are able to see near uniformity in the symmetry of the frequency spread, especially for the fastest speed of rotation.